Java process >100%cpu, find the guilty thread
How to find a java process is eating the whole CPU without reasons, find the responsible…

It’s a rainy friday… and my checkmk monitoring alert me about this: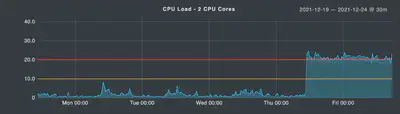
It’s a application server VM where are running several Python and Java softwares belonging to an our product. Seeems that something happened and now the CPU load is very high than normal. It’s not normal and seems not temporarly.
First dig
Found via top/htop that the responsible is as single Java process… It’s an our legacy and very consolidated software that is not modified ealier. We need to find what is causing this strange usage and find the root cause in order to mitigate. That Java process have hundreds of threads and is very complicated…
Telemetry
All the telemetry data of the application are under the normal limits. No abuses or peaks.
Logs / Debug
Normal logs give us no useful information. All is working fine. Enabled the debug mode: no useful info, we see normal traffic belonging correctly to the application and all is working fine.
So?
It’s time to trace the Java process… who ever do it? It’s the time for the first time…
How to trace a java process?
I really don’t know. I need to found the thread responsible of the abnormal CPU usage. Does exist a TOP like command for a Java process? Asking to Google I found this jvmtop.
Is very simple:
jvmtop $PID
Executed on my system and the output is very similar to top/htop command. Unfortunately all top consuming CPU threads are named Receiver-179, Receiver-190, etc… The good news is that now we know the Thread name… the bad news is that these thread names does not belong to our codebase but are thread named by a third parties library…
We need more info…how?
Googling… found the tool jstack already bundled in the JDK by default.
Jstacking my Java app
It’s time to jstacking my java app. This tool give your as output the full stack trace of the java process with a output like this:
"Thread-514" #538 prio=5 os_prio=0 tid=0x00007ffab06c5800 nid=0x5db0 runnable [0x00007ffa81758000]
   java.lang.Thread.State: RUNNABLE
        at java.lang.Thread.yield(Native Method)
        at org.smpp.util.ProcessingThread.stop(ProcessingThread.java:162)
        at org.smpp.Receiver.stop(Receiver.java:219)
        at it.besms.server.SMSCSession.run(SMSCSession.java:142)
        - locked <0x00000000ee6efcd0> (a it.besms.server.SMSCSession)
        at java.lang.Thread.run(Thread.java:748)

"Receiver-179" #532 prio=5 os_prio=0 tid=0x00007ffacc048800 nid=0x5dac runnable [0x00007ffa81354000]
   java.lang.Thread.State: RUNNABLE
        at java.net.SocketInputStream.socketRead0(Native Method)
        at java.net.SocketInputStream.socketRead(SocketInputStream.java:116)
        at java.net.SocketInputStream.read(SocketInputStream.java:171)
        at java.net.SocketInputStream.read(SocketInputStream.java:141)
        at java.io.BufferedInputStream.read1(BufferedInputStream.java:284)
        at java.io.BufferedInputStream.read(BufferedInputStream.java:345)
        - locked <0x00000000ee71f1d8> (a java.io.BufferedInputStream)
        at org.smpp.TCPIPConnection.receive(TCPIPConnection.java:413)
        at org.smpp.ReceiverBase.receivePDUFromConnection(ReceiverBase.java:197)
        at org.smpp.Receiver.receiveAsync(Receiver.java:358)
        at org.smpp.ReceiverBase.process(ReceiverBase.java:96)
        at org.smpp.util.ProcessingThread.run(ProcessingThread.java:191)
        at java.lang.Thread.run(Thread.java:748)
With the information got from jvmtop, I know the thead names and with this output I can find the classes involved on these threads and debug more deeply on the source code.
These threads are belonging to a Java SMPP library. The classes involved are regarding the inbound SMPP traffic.
Root cause
Now we can point the attention to the right direction: Inbound SMPP traffic.
We checked more deeeply the logs of that specific part and found a single host that is trying to authenticate about 20 times/sec and it was refused by the application for a internal reason. Analyzing the source code we found the root cause of the issue and was a bug on the library that cause a abnormal usage of CPU of theese threads if they are closed too quickly.
Mitigation
In order to mitigate the issue we dropped the host traffic.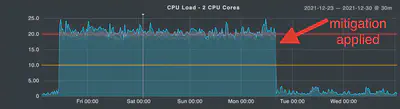
Afterthat we fixed the issue on the source code and deployed a final fix.
Debug/trace a Java process is not a so trivial issue! ;)
Thanks for reading!